
Introduction
A year-over-year (YOY) analysis is a numerical comparison of two data sets, one set from one year and the other from the previous year. When comparing economic or financial indicators, it is common to practise making comparisons over periods of one year or more. By comparing data from one year to the next, you can examine the overall trend of an indicator over time, as opposed to just its weekly or monthly fluctuations. Having a broader time horizon to look at data helps put the performance of an economy or an investment into context. Let's get into what "year-over-year" implies and how it operates. Here you’ll learn about what is Year-Over-Year (YOY)?
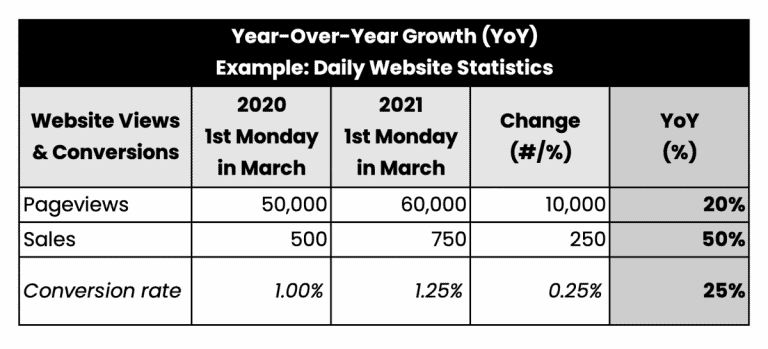
How Does Comparing One Year to Another Work?
Many government organizations report economic trends by comparing data from the preceding year, providing a picture of the economy's trajectory over the last 12 months. Year-over-year comparisons can be easily calculated, allowing for clear comparisons throughout time. Significant economic indicators such as the consumer price index, gross domestic product, unemployment rates, and interest rates are all released in this format. Moreover, firms will use year-over-year data to calculate essential financial success measures.
Formulas that compare the current year to the prior year are frequently used when presenting economic data. Monthly growth rates may be annualized instead by some government bodies. The process of annualizing a percentage change uses the monthly growth rate of a particular variable to calculate the change in that variable over a year if its growth rate remains constant throughout the year.
Businesses and investors can use a helpful measure comparing current results to those from the previous year. Sometimes, providing a monthly revenue or investment return breakdown may be instructive. A great month may be lost in the annual average if you only look at the totals. However, if only month-to-month comparisons are conducted, a terrible month for the business will likely escape overlooked.
Another downside of using year-over-year data to make calculations is that it does not provide a thorough explanation of the elements that lead to economic or corporate growth. Trends can be spotted using measurements made from one year to the next, but this is not enough information to explain the causes of those trends.
How to Understand the Year-Over-Year Calculations Presented on an Investment Statement?
The majority of corporations issue annual reports to investors. Meta (formerly known as Facebook) just updated its investor page with key points from its financial projections for 2021. Beginning in late 2020 and continuing through late 2021, this statement will show the transitions from one year to the next during that time frame. In addition, the statement shows that in 2021, Meta's net income was $39.4 billion, representing a rise over the $29.1 billion recorded in 2020.
This is an increase of 35% over the previous year and suggests that the company's net income shot up considerably during the previous year. Meta's sales dropped by -8% from the same period in 2020, when it was $11.2 billion, to $10.3 billion in the final three months of 2021. This indicates that Meta's net income has improved significantly over the last year; however, this improvement must have occurred during the first nine months of the year, as net income year over year for the final three months was lower by 8%.
Benefits of YOY
Using year-over-year (YOY) metrics facilitates comparisons across datasets. Year-over-year data for a company's first-quarter revenue allows a financial analyst or investor to quickly identify if the company's revenue is increasing or decreasing. Year-over-year data can be used for this purpose.
For example, the Coca-Cola company had a five percent increase in net revenues in the first quarter of 2021 compared to the same period the year before. Despite seasonal influences on consumer behaviour, reliable comparisons can be made by looking at the same months from different years. If you're looking to analyze your investment portfolio, comparing your performance yearly is a great place to start. Investors often compare results from one year to the next to see how performance has changed over time.
Conclusion
The acronym "YoY" refers to a financial analysis method that compares time series data from one year to the next. The young analysis allows analysts to infer whether there have been increases or decreases in the quantity or quality of particular company elements. When determining if a financial instrument is meeting expectations, it is common for investors to evaluate its performance from one year to the next. Growth patterns and trend analysis can also benefit significantly from this analysis.